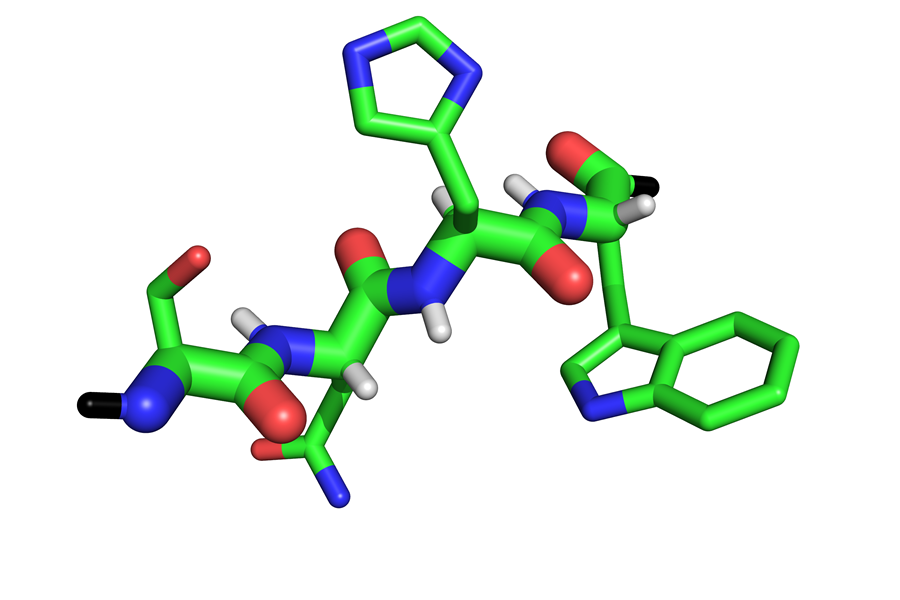
The pictures in the table below represent a pictorial Ramachandran diagram, showing a peptide corresponding to the inidcated phi,psi angles. Click on a cell to see an enlarged version of the image and a link to the corresponding PDB file. The alpha helix and the beta sheet are shown at the bottom at full size -- click to go directly to the pdb file. All three of the peptide bonds in the tetrapeptide Ser-Asn-His-Trp are assigned the indicated phi and psi angles. The images are aligned so that the central peptide bond is roughly in the same orientation in each panel. Conformations and images were generated using Insight95 (Biosym) on an SGI O2. Note that the previous version (pre 3/24/98) was upside down -- oops. And there was an error in the Newman projection diagram that lingered for 14 years until discovered and fixed in 2012.
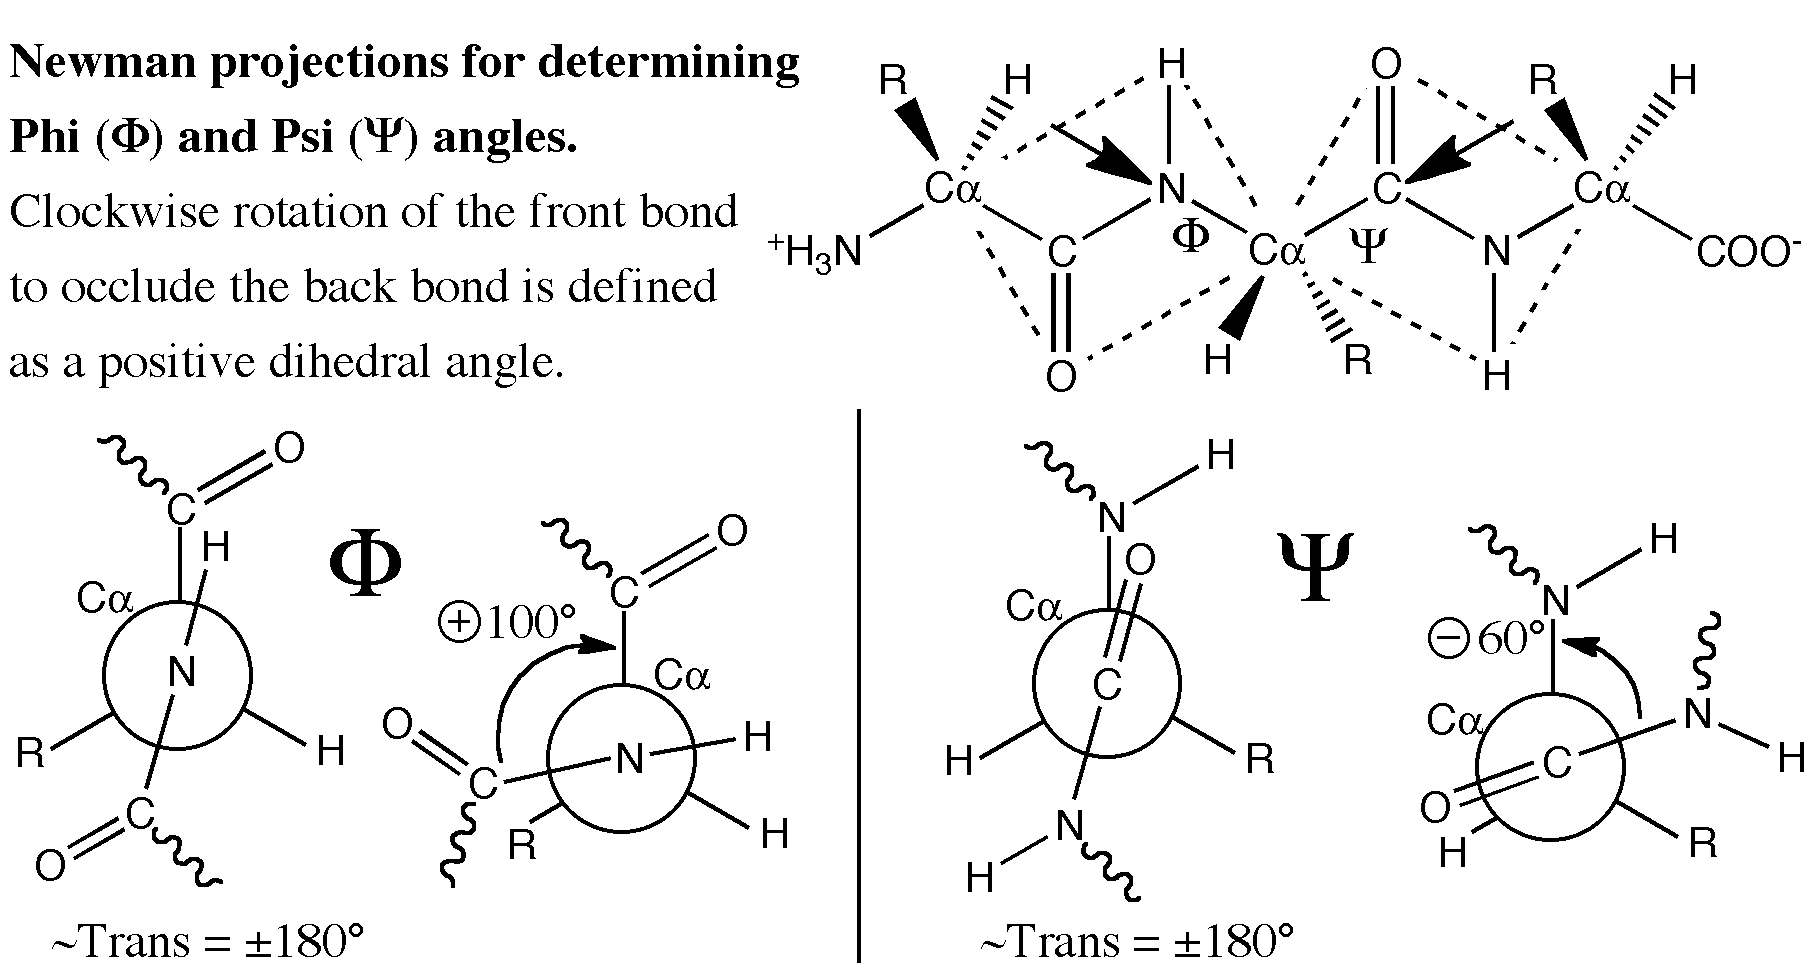
Here is a sketch of a peptide showing the definitions of the Phi and Psi angles, and a blow-up of Phi = -120, Psi = +120.
| Phi | |||||||
|---|---|---|---|---|---|---|---|
| Psi | -180 | -120 | -60 | 0 | 60 | 120 | 180 |
| 180 |
|
|
|
|
|
|
|
| 120 |
|
|
|
|
|
|
|
| 60 |
|
|
|

|
|
|
|
| 0 |
|
|
|
|
|
|
|
| -60 |
|
|
|
|
|
|
|
| -120 |
|
|
|
|
|
|
|
-180 |
|
|
|
|
|
|
|
| Alpha helix: Phi = -57, Psi = -47 | Antiparallel Beta sheet: Phi = -139, Psi = 135 | ||||||
|
|
Designed by J. Kahn, created by J. Kahn and R. Mehta | |||||